01 / ON TIMEDelivery completed as expected
5.83%REFUND RATE
01 // BUSINESS PROBLEM · PROFITGUARD
Where is an e-commerce business losing profit?
ProfitGuard connects revenue, refunds, delivery, customer, product, payment and marketing data to find where profit is leaking.
FOLLOW THE DATA
02 // WHAT I FOUND
In the project data, refund rates were higher for late-delivery orders. That association made delivery performance the clearest place to investigate.
Late delivery was associated with higher refund risk in this dataset.


03 // WHAT I BUILT
From cloud data to practical refund-risk recommendations.
03 // REAL POWER BI · 5 REPORT PAGES
These are the project’s real report screenshots. Select a page to bring it forward, or enlarge it to read the details.
See order volume, net revenue, refunds and the headline operating measures together.
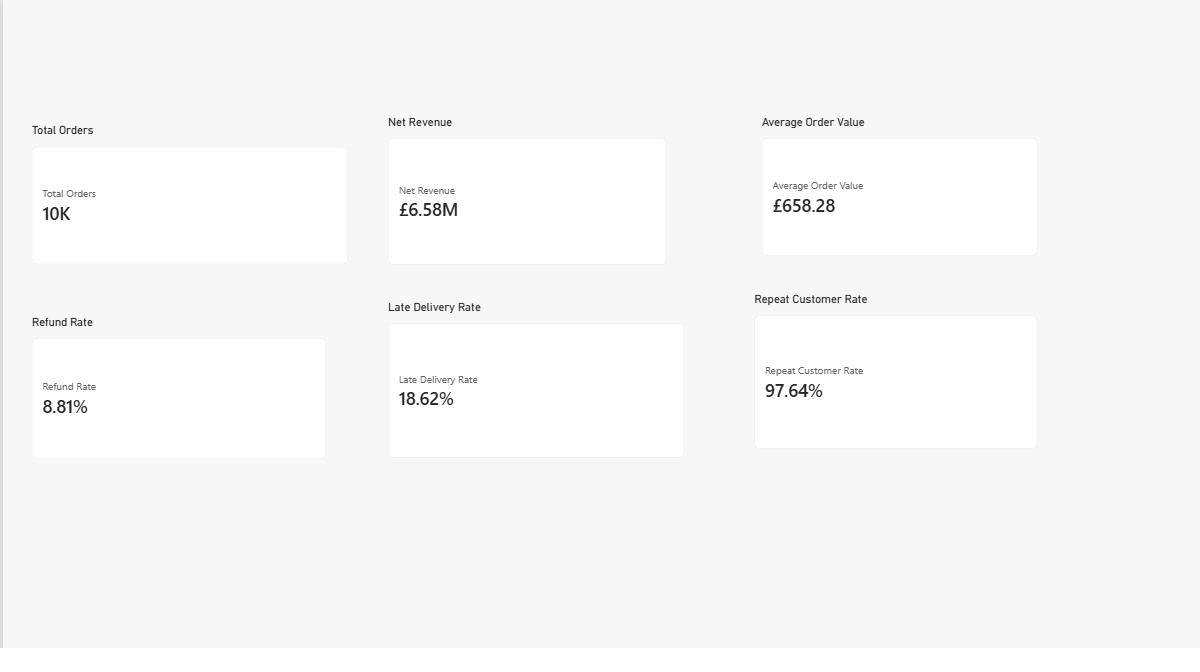
Actual ProfitGuard Power BI exports · synthetic project data · dashboard screenshots are not mockups.
Amazon S3 · AWS Glue · Athena · SQL · Python · Logistic Regression · hypothesis testing · historical discount comparison.
Eight datasets become queryable tables, then statistical and machine-learning analysis feeds the Power BI report and recommendations.
29 orders (0.29%) had discounts greater than gross order value. Those rows were retained, flagged, and their net order value was floored at zero for downstream analysis.
04 // HISTORICAL CONTROL VS TREATMENT
This is an A/B-style analysis of historical orders, not a randomized experiment.
More discount ≠ higher order value
Historical groups can differ in other ways. This comparison does not establish that discount level caused the order-value difference.
05 // REFUND-RISK SCREENING
ProfitGuard compares order signals to help identify cases that may deserve earlier attention. This is an early-warning screening model, not an automated production decision system.
DUMMY BASELINEReference point
LOGISTIC REGRESSION SELECTEDBest-performing model in this project comparison
RANDOM FORESTWeaker minority-class performance
Metrics are moderate: a useful screening signal for investigation, not a production-ready automated decision.
06 // ANALYTICS DEPTH
Reusable query patterns and analysis move from data checks to revenue, refund and marketing questions.
01Revenue→
02Products→
03Customers→
04Refunds→
05Delivery→
06Payments→
07Marketing→
08Data Quality→
04 // BUSINESS IMPACT
Three practical recommendations from the evidence.
Late deliveries were associated with a 24.97% refund rate, compared with 5.83% for on-time orders.
Prioritise delay prevention and proactively support orders at risk of arriving late.
Logistic Regression reached 0.700 ROC-AUC in this project.
Use risk scores to help prioritise review or outreach, with people in the decision loop.
The higher-discount group had lower average net order value; the historical difference was not significant.
Run a properly randomised experiment before changing discount strategy at scale.
PROFITGUARD // E-COMMERCE PROFIT LEAKAGE ANALYTICS
10,000 orders, eight connected datasets and one clear place to start: delivery performance.