UCI APPLIANCES ENERGY PREDICTION
Appliance energy
forecasting.
Can we forecast a full day of household energy use using only information available at the forecast time?
I built a leakage-safe, day-ahead forecasting study and compared statistical, machine-learning and foundation models on the same rolling test days.

THE APPROACH
A forecast made
before tomorrow.
The source data records appliance energy every 10 minutes. I aggregated it to complete hourly observations, then set each forecast origin at 23:00: use the history available that evening to predict the next 24 hours.
Training, validation and test periods follow calendar order. Validation selected modelling choices; the final 30 test days remained held out until evaluation. Future target readings and future sensor values were excluded from operational forecasts.
HELD-OUT TEST RESULTS
SARIMAX had the
lowest RMSE.
Each model was evaluated on the same 30 forecast days. Errors are in watt-hours (Wh); lower is better.
| MODEL | RMSE (Wh) | MAE (Wh) | NOTE |
|---|---|---|---|
| SARIMAX | 375.2 | 217.7 | Lowest RMSE |
| Chronos-T5 · zero-shot | 405.8 | 197.7 | Foundation model |
| Mean baseline | 418.7 | 290.7 | Validation-selected reference |
| XGBoost · direct | 422.2 | 253.8 | 24 horizon-specific models |
| Weekly seasonal naive | 463.3 | 245.8 | 168-hour seasonal baseline |
| Daily seasonal naive | 477.1 | 263.0 | 24-hour seasonal baseline |
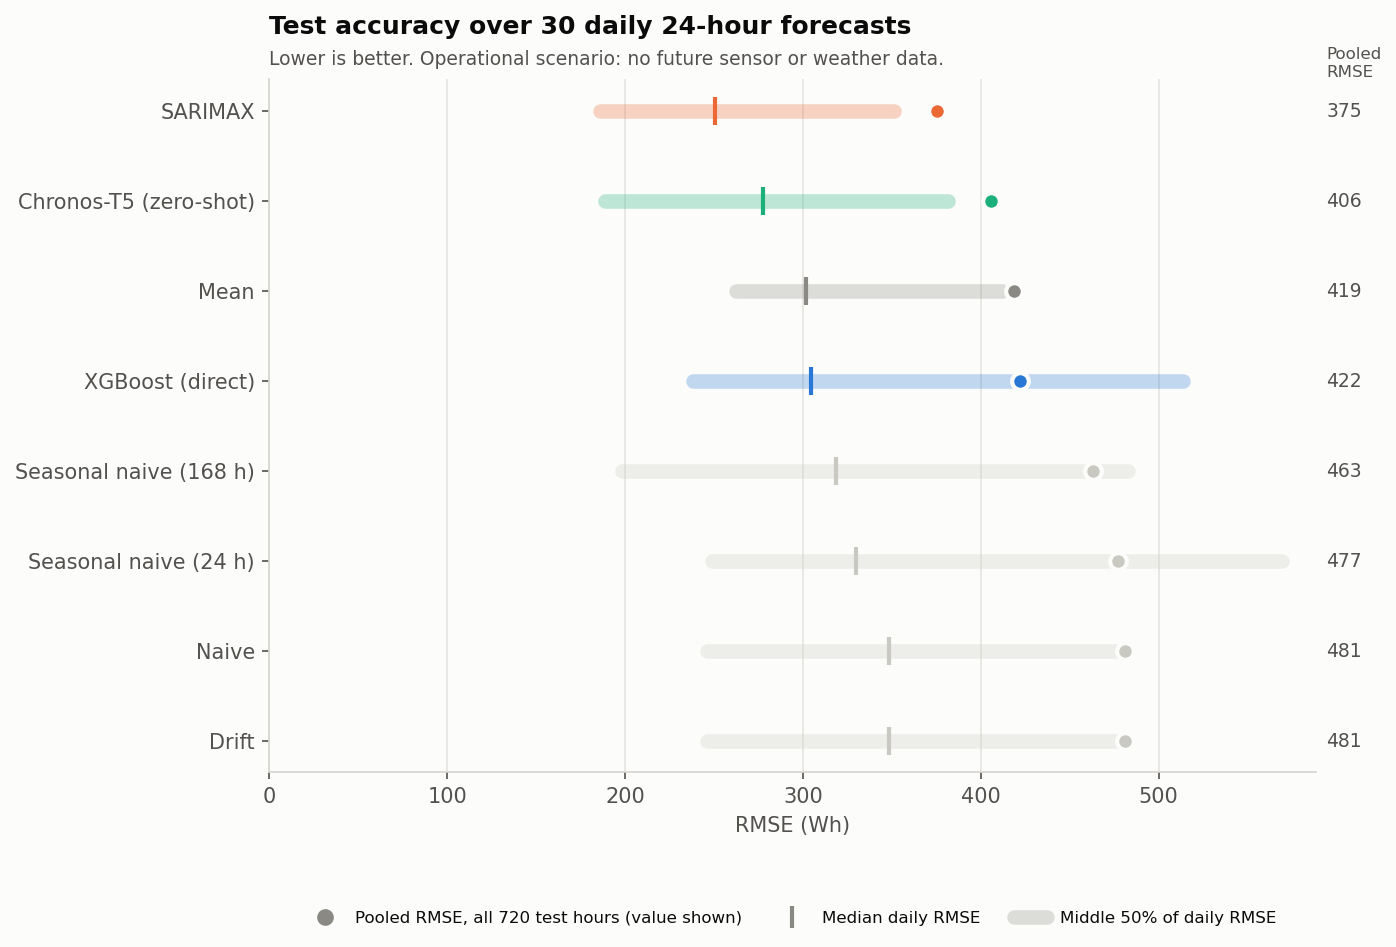
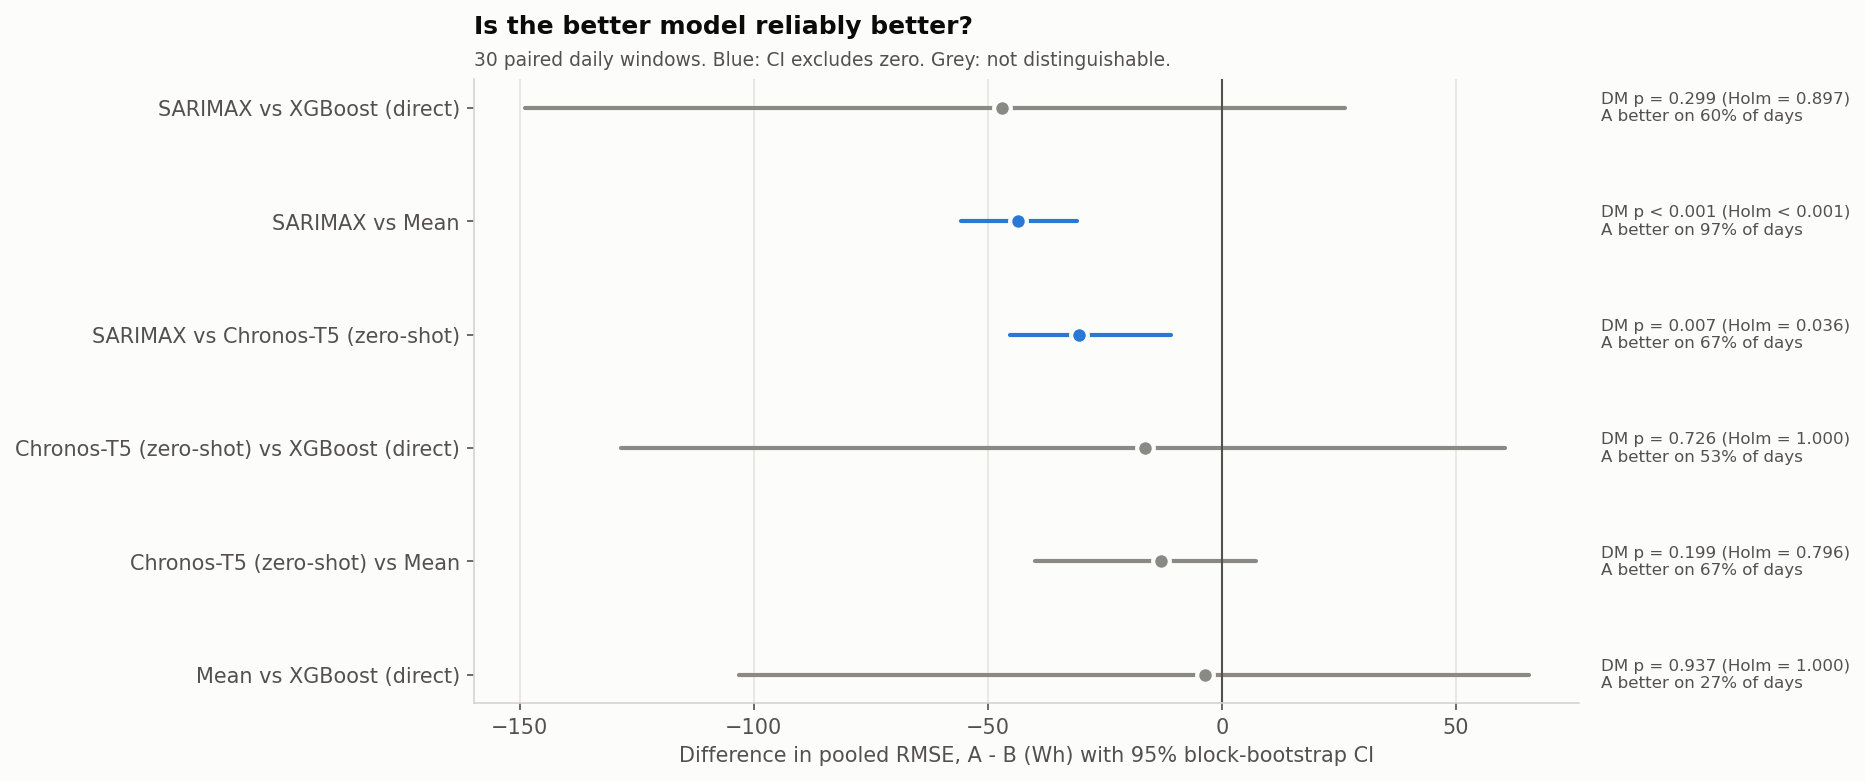
The 10.4% RMSE reduction is measured against the mean baseline selected using validation data. Direct XGBoost and SARIMAX were not statistically distinguishable in paired test-day comparisons.
FROM THE EXPERIMENT
Forecasts, errors
and explanations.
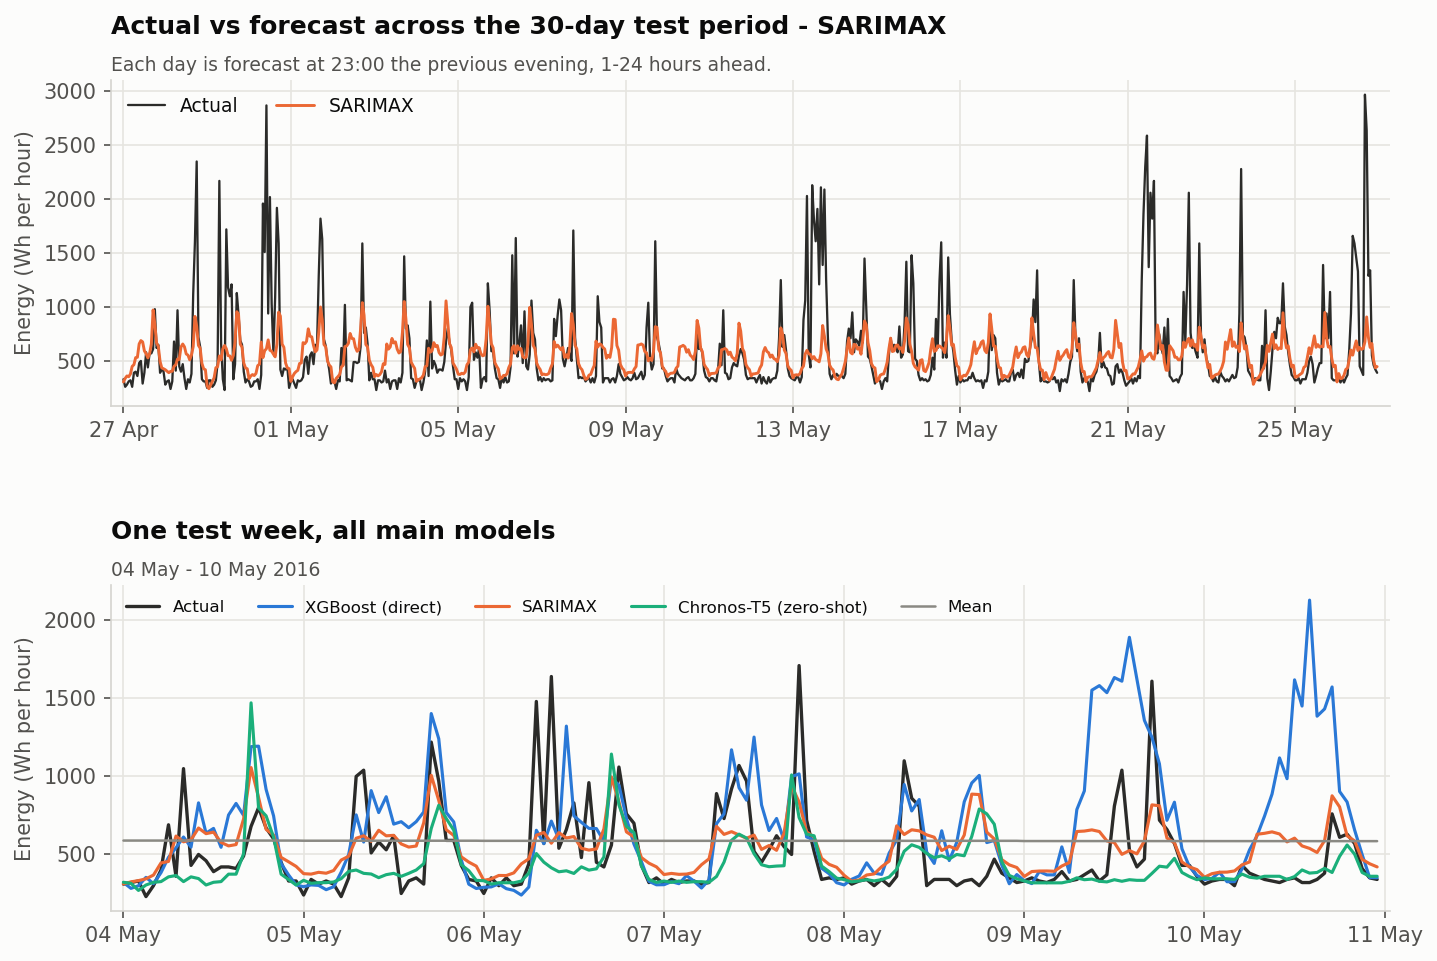
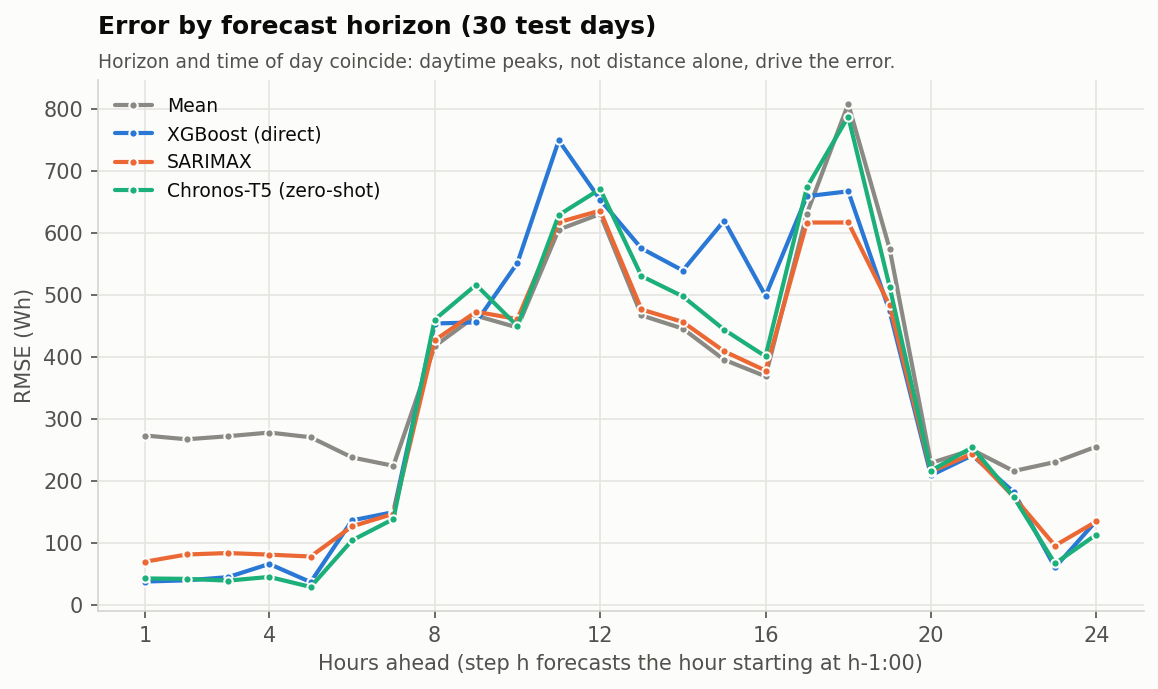
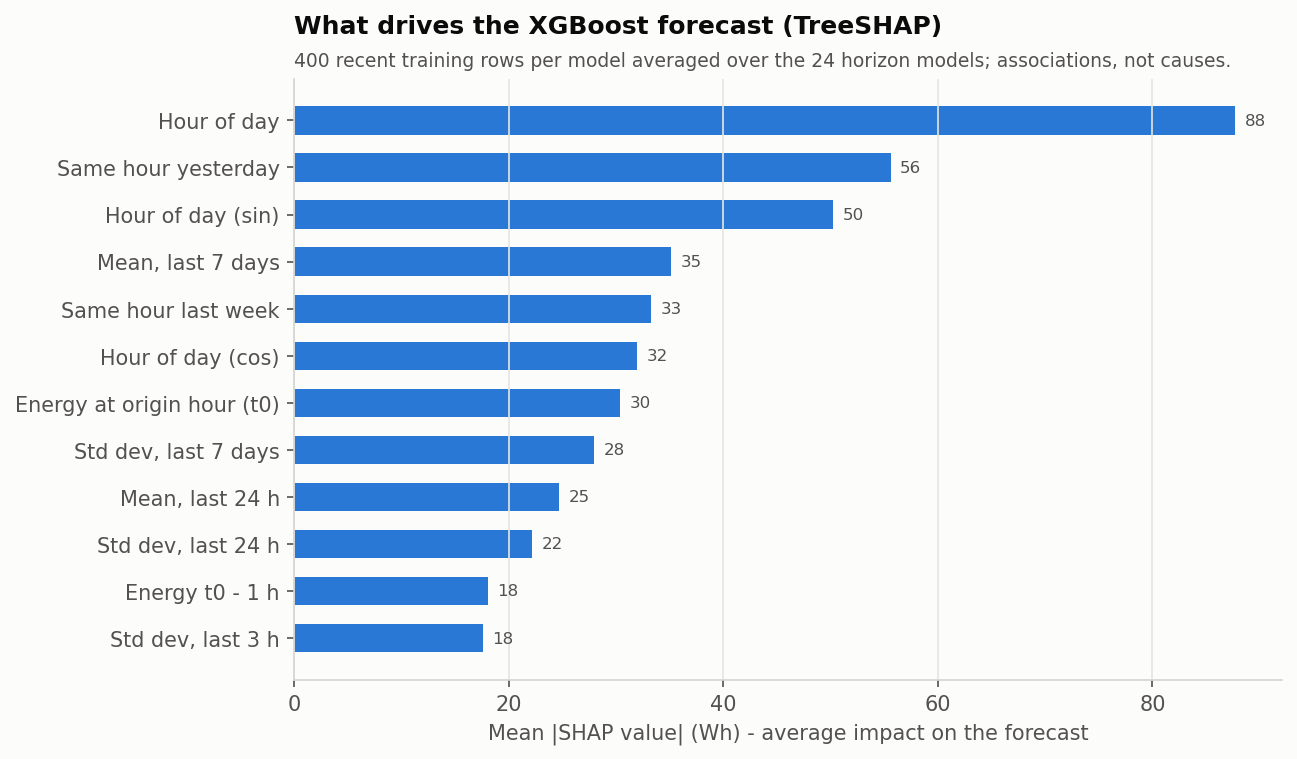
Figures from the completed experiment, showing how the models forecast, where they miss, and which inputs influenced XGBoost.
Technical and statistical details
Models
SARIMAX, direct multi-horizon XGBoost and zero-shot Chronos-T5, compared with mean, naive, drift, daily seasonal and weekly seasonal baselines.
Selection and testing
Model choices were made on a 14-day validation period before an untouched 30-day test. Diebold–Mariano tests used daily squared errors with HAC variance and Holm correction; confidence intervals used a moving-block bootstrap.
What the comparisons support
SARIMAX beat the mean baseline on 29 of 30 test days (Holm-corrected p < 0.001). Its difference from direct XGBoost was not statistically significant (p = 0.897).
Uncertainty and limits
SARIMAX’s nominal 95% prediction interval covered 95.8% of test hours. The study uses one household and a short late-spring period, so results may not transfer to other homes or seasons. SHAP values show learned associations, not causes.